

TL;DR
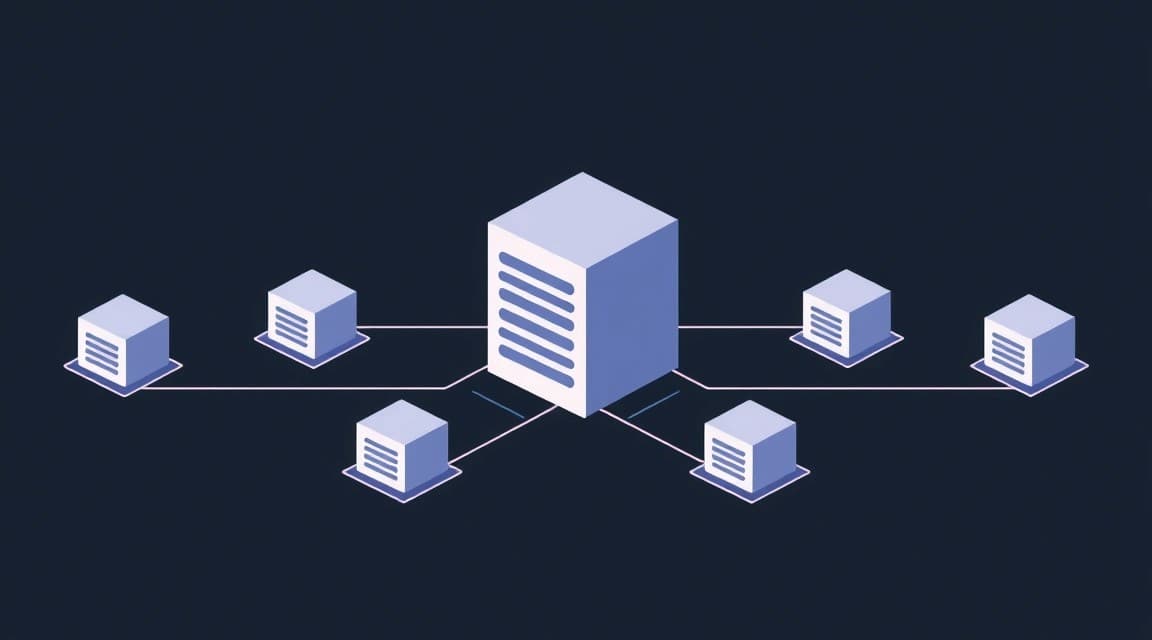
In this detailed guide, we will step-by-step set up a centralized log collection and analysis system on your VPS using the Grafana Loki stack. You will learn how to install and configure Loki for log storage, Promtail for collecting logs from your applications, and Nginx as a reverse proxy with HTTPS for secure access. As a result, you will get a powerful and scalable solution for efficient monitoring of events on your server and applications.
- Installing Grafana Loki and Promtail as Systemd services.
- Configuring Nginx as a reverse proxy for Loki with HTTPS support via Certbot.
- Configuring Promtail to collect logs from various sources and send them to Loki.
- Ensuring secure access to the Loki UI via Nginx and TLS.
- Step-by-step instructions for server preparation, installation, configuration, backups, and troubleshooting.
What we are setting up and why
In today's world, where applications and services generate huge volumes of data, centralized logging becomes not just a convenience, but a necessity. We will be deploying Grafana Loki — a horizontally scalable, highly available, multi-tenant log aggregation system developed by Grafana Labs. Loki differs from other logging systems in that it indexes only log metadata (labels), while storing the logs themselves in a compressed form. This makes it very efficient in terms of resource usage and storage cost.
As part of this tutorial, we will set up a complete stack for centralized collection, storage, and access to logs:
- Grafana Loki: The core of the system, which accepts logs, indexes them by labels, and stores them.
- Promtail: An agent installed on each server where logs are generated. It monitors specified log files, applies labels to them, and sends them to Loki.
- Nginx: Will act as a reverse proxy for Loki, providing secure access via HTTPS and the ability to host Loki on standard ports.
- Systemd: We will use Systemd to manage Loki and Promtail services, ensuring their automatic startup and monitoring.
Ultimately, the reader will get a fully functional centralized logging system. This will allow collecting logs from all your applications and services on a VPS (or multiple VPSs), viewing them in a convenient Grafana interface (which can be connected to Loki), quickly finding necessary events, debugging problems, and monitoring system status. This significantly simplifies infrastructure management, especially when you have multiple services or microservices deployed on one or different servers.
Alternatives: Cloud-managed vs. Self-hosted on VPS
There are several approaches to centralized logging:
- Cloud-managed services (SaaS): Platforms such as Datadog, Splunk Cloud, Logz.io, AWS CloudWatch, Google Cloud Logging, Azure Monitor. They offer ready-made solutions with minimal setup, high availability, scalability, and rich functionality. Pros: Ease of use, no need to manage infrastructure, powerful analytical tools. Cons: High cost, especially with large log volumes; potential data privacy concerns, as logs are stored with a third-party provider; less control over the infrastructure.
- Self-hosted solutions on a dedicated server/VPS: This is the approach we are implementing with Loki. You have complete control over the entire system, from infrastructure to configuration. Pros: Full control over data and security, potentially significantly lower cost for large log volumes (paying only for VPS/dedicated), flexibility in customization for specific needs. Cons: Requires technical knowledge for deployment and maintenance, responsibility for availability and scaling lies with you.
Choosing a self-hosted solution on a VPS with Loki is particularly relevant for VPS owners, developers, solo founders, and enthusiasts who want full control over their infrastructure, optimize costs, and not depend on third-party cloud providers. Loki, thanks to its design, is an excellent choice for this task, as it is less resource-intensive compared to other systems like the ELK stack (Elasticsearch, Logstash, Kibana), especially in terms of RAM and disk space consumption due to indexing only metadata.
What VPS configuration is needed for this task
Choosing the right VPS for Grafana Loki depends on the volume of logs you plan to collect and their retention period. Loki efficiently compresses logs, but still requires sufficient disk space and moderate CPU/RAM resources for indexing and queries.
Minimum requirements for Loki and Promtail (for small projects, up to 100 GB logs per month)
- CPU: 2 cores. Loki and Promtail do not heavily load the processor in idle mode, but peak loads during indexing or complex queries may require more.
- RAM: 4 GB. Loki can be quite memory-hungry with large query volumes or long-term index storage in memory. Promtail consumes little.
- Disk: NVMe SSD from 100 GB. Disk speed is critical for writing logs and executing queries. Volume depends on log volume and retention policy. For 100 GB of logs per month and 3 months of storage, about 300 GB will be needed.
- Network: 100 Mbps. For transferring logs from Promtail to Loki and accessing the UI.
Recommended VPS plan for medium projects (up to 500 GB logs per month, multiple sources)
For more serious tasks, where you collect logs from several applications or servers, and expect up to 500 GB of logs per month, you should consider a more powerful configuration:
- CPU: 4 cores.
- RAM: 8 GB.
- Disk: NVMe SSD from 500 GB to 1 TB.
- Network: 1 Gbps.
Such a plan will provide sufficient performance for processing queries and storing a larger volume of data. You can consider a VPS with the specified characteristics for deploying your centralized logging system.
When a dedicated server is needed, not a VPS
A dedicated server becomes preferable when:
- Very large log volumes: If you plan to collect terabytes of logs per month (e.g., from a large Kubernetes cluster or many microservices).
- High query performance: Instant access to logs and execution of complex analytical queries on huge data arrays are required.
- Guaranteed resources: You need 100% guaranteed CPU, RAM, and disk resources, without the "noisy neighbor" effect sometimes found on VPS.
- Strict storage requirements: Need for RAID arrays to increase disk subsystem reliability or specific disk type requirements (e.g., high-performance HDDs for archival log storage, together with SSDs for hot data).
- Physical isolation: To comply with strict security standards and compliance (e.g., PCI DSS, HIPAA), where complete physical isolation is required.
For most individual developers, solo founders, and small teams, a VPS will be more than sufficient and more cost-effective. However, if you see that your log volume exceeds 1-2 TB per month, or VPS performance begins to suffer, transitioning to a suitable dedicated server will be justified.
VPS Location: What it affects
The choice of VPS location affects several key aspects:
- Latency: The closer the VPS is to the log sources (your other servers, application clients), the lower the latency for log transmission. This is important for operational monitoring and reducing network load.
- Legal compliance: Some jurisdictions have strict data storage requirements, including logs. Ensure that the chosen location complies with applicable data privacy laws (e.g., GDPR in Europe).
- Cost: VPS prices can vary depending on the region.
- Availability: Choose regions with good network infrastructure and high data center availability.
Ideally, choose a location that is geographically close to your main log-generating servers to minimize network latency and ensure fast data transfer.
Server preparation
Server Preparation
Before proceeding with the installation of Loki and Promtail, you need to perform basic setup of your fresh VPS. This will enhance security and usability.
It is assumed that you are using Ubuntu Server 22.04 LTS or 24.04 LTS distribution, which is a popular choice for VPS.
1. SSH Connection and System Update
Connect to your server via SSH using the credentials provided by your provider. This is usually the root user and password.
ssh root@YOUR_IP_ADDRESS
After successful login, update the package list and installed packages to their latest versions:
sudo apt update && sudo apt upgrade -y
2. Creating a New User with Sudo Privileges
Working as the root user is insecure. Let's create a new user and grant them sudo privileges.
adduser lokiadmin
usermod -aG sudo lokiadmin
Now, exit the root session and log in as the new user:
exit
ssh lokiadmin@YOUR_IP_ADDRESS
3. Configuring SSH Key Authentication
To enhance security, it is recommended to use SSH keys instead of passwords. If you don't have keys yet, generate them on your local machine:
ssh-keygen -t rsa -b 4096
Copy the public key to the server (replace lokiadmin and YOUR_IP_ADDRESS):
ssh-copy-id lokiadmin@YOUR_IP_ADDRESS
Now you can disable password authentication for SSH. Edit the file /etc/ssh/sshd_config:
sudo nano /etc/ssh/sshd_config
Find and change the following lines:
#PasswordAuthentication yes
PasswordAuthentication no
#PermitRootLogin yes
PermitRootLogin no
Save changes (Ctrl+O, Enter) and exit (Ctrl+X). Restart the SSH service:
sudo systemctl restart sshd
After this, ensure that you can log in with your SSH key before closing the current session.
4. Firewall Configuration (UFW)
UFW (Uncomplicated Firewall) is a convenient wrapper for iptables. Install and configure it:
sudo apt install ufw -y
sudo ufw allow OpenSSH
sudo ufw allow http
sudo ufw allow https
sudo ufw enable
sudo ufw status
Check the status. Ports 22 (SSH), 80 (HTTP), and 443 (HTTPS) should be allowed. We will add a port for Loki later.
5. Installing Fail2Ban
Fail2Ban helps protect against brute-force attacks by blocking IP addresses that make too many failed login attempts.
sudo apt install fail2ban -y
sudo systemctl enable fail2ban
sudo systemctl start fail2ban
Fail2Ban protects SSH by default. You can configure it by editing the file /etc/fail2ban/jail.local (create it if it doesn't exist) and adding your rules.
6. Installing Basic Utilities
Install several useful utilities that will come in handy during setup and debugging:
sudo apt install curl wget git nano htop unzip -y
Your server is now ready for deploying Grafana Loki and Promtail.
Software Installation — Step-by-step
We will install Loki and Promtail by downloading binary files from official GitHub repositories and configuring them as Systemd services. Nginx will be installed from the APT repository.
The actual software versions for 2026 will be conditional, but we will use the latest stable releases available at the time of generation.
Installing Grafana Loki
Let's create directories for Loki and download the current binary file.
# 1. Create directories for Loki
sudo mkdir -p /etc/loki
sudo mkdir -p /var/lib/loki
sudo chown -R lokiadmin:lokiadmin /var/lib/loki # Grant write permissions to the current user

# 2. Change to a temporary directory
cd /tmp

# 3. Download the latest stable version of Loki (e.g., v3.1.0 for 2026)
# Always check the latest version on GitHub: https://github.com/grafana/loki/releases
LOKI_VERSION="3.1.0" # Specify the current version
wget "https://github.com/grafana/loki/releases/download/v${LOKI_VERSION}/loki-linux-amd64.zip"

# 4. Unzip the archive
unzip "loki-linux-amd64.zip"

# 5. Move the binary file to /usr/local/bin
sudo mv loki-linux-amd64 /usr/local/bin/loki

# 6. Ensure the file is executable
sudo chmod a+x /usr/local/bin/loki

# 7. Check the version
loki --version
Now, let's create a loki user, under whom the service will run, to ensure the principle of least privilege.
# 1. Create a system user loki without a home directory and shell
sudo useradd --system --no-create-home --shell /bin/false loki

# 2. Transfer ownership of the Loki data directory to the loki user
sudo chown -R loki:loki /var/lib/loki
Installing Promtail
Similar to Loki, let's download and install Promtail.
# 1. Create a directory for Promtail
sudo mkdir -p /etc/promtail

# 2. Change to a temporary directory
cd /tmp

# 3. Download the latest stable version of Promtail (e.g., v3.1.0 for 2026)
# Always check the latest version on GitHub: https://github.com/grafana/loki/releases
PROMTAIL_VERSION="3.1.0" # Specify the current version
wget "https://github.com/grafana/loki/releases/download/v${PROMTAIL_VERSION}/promtail-linux-amd64.zip"

# 4. Unzip the archive
unzip "promtail-linux-amd64.zip"

# 5. Move the binary file to /usr/local/bin
sudo mv promtail-linux-amd64 /usr/local/bin/promtail

# 6. Ensure the file is executable
sudo chmod a+x /usr/local/bin/promtail

# 7. Check the version
promtail --version
Let's create a promtail user to run the service.
# 1. Create a system user promtail without a home directory and shell
sudo useradd --system --no-create-home --shell /bin/false promtail
Installing Nginx and Certbot
Nginx will act as a reverse proxy and provide HTTPS access to Loki. Certbot will help automate the issuance and renewal of TLS certificates from Let's Encrypt.
# 1. Install Nginx from Ubuntu repositories
sudo apt install nginx -y

# 2. Start Nginx and enable it to start on boot
sudo systemctl start nginx
sudo systemctl enable nginx

# 3. Install Certbot and the Nginx plugin
sudo apt install certbot python3-certbot-nginx -y
At this stage, the main components are installed. Now let's proceed to their configuration.
Configuration
Proper configuration is key to stable and efficient system operation. We will configure Loki, Promtail, Nginx, and Certbot.
Loki Configuration
Let's create a configuration file for Loki /etc/loki/config.yaml. This file defines how Loki will store logs, which ports to listen on, and other parameters.
sudo nano /etc/loki/config.yaml
Insert the following content:
auth_enabled: false # For simplicity, authentication is disabled. For production, consider basic_auth or OIDC

server:
  http_listen_port: 3100 # Port on which Loki will listen for HTTP requests
  grpc_listen_port: 9095 # Port for gRPC (used by Promtail)

common:
  path_prefix: /var/lib/loki/wal # Path for Write-Ahead Log
  replication_factor: 1 # Number of replicas for data storage
  ring:
    instance_addr: 127.0.0.1
    kvstore:
      store: inmemory # For a simple installation, we use inmemory; for production, consider Consul/Etcd
    replication_factor: 1

schema_config:
  configs:
    - from: 2020-10-24 # Start date for using this schema
      store: boltdb-shipper # Use boltdb-shipper for index storage
      object_store: filesystem # Store log chunks on the filesystem
      schema: v12
      index:
        prefix: index_
        period: 24h

storage_config:
  boltdb_shipper:
    active_index_directory: /var/lib/loki/boltdb-shipper-active # Directory for active indexes
    cache_location: /var/lib/loki/boltdb-shipper-cache # Directory for index cache
    resync_interval: 5s
    shared_store: filesystem
  filesystem:
    directory: /var/lib/loki/chunks # Directory for storing log chunks

compactor:
  working_directory: /var/lib/loki/compactor # Directory for the compactor
  shared_store: filesystem

limits_config:
  enforce_metric_name: false
  reject_old_samples: true
  reject_old_samples_max_age: 168h # Reject samples older than 7 days
  max_query_lookback: 720h # Maximum period for queries (30 days)
  max_query_series: 5000 # Maximum number of series in a query
  max_query_length: 720h # Maximum query duration
  max_global_streams_per_user: 5000000
  max_streams_per_user: 100000

ruler:
  storage:
    type: local
    local:
      directory: /var/lib/loki/rules
  rule_path: /var/lib/loki/rules-temp
  alertmanager_url: http://localhost:9093 # Example, if you will use Alertmanager
  ring:
    kvstore:
      store: inmemory

# Query settings (query-frontend, query-scheduler)
query_range:
  align_queries_with_step: true

# Ingester settings (component that receives logs)
ingester:
  lifecycler:
    address: 127.0.0.1
    ring:
      kvstore:
        store: inmemory
      replication_factor: 1
    final_sleep: 0s
  chunk_idle_period: 5m
  max_transfer_retries: 0
Save the file. Now, let's create a Systemd service for Loki.
sudo nano /etc/systemd/system/loki.service
Insert the following content:
[Unit]
Description=Loki log aggregation system
After=network.target

[Service]
User=loki
Group=loki
Type=simple
ExecStart=/usr/local/bin/loki -config.file /etc/loki/config.yaml
Restart=on-failure
RestartSec=5s

[Install]
WantedBy=multi-user.target
Save the file, reload Systemd, and start Loki:
sudo systemctl daemon-reload
sudo systemctl start loki
sudo systemctl enable loki
sudo ufw allow 3100/tcp # Open Loki port
sudo ufw reload
Check Loki's status:
sudo systemctl status loki
It should show active (running).
Promtail Configuration
Now, let's configure Promtail to collect logs. Create the file /etc/promtail/config.yaml.
sudo nano /etc/promtail/config.yaml
Insert the following content. This example will collect syslog and Nginx logs.
server:
http_listen_port: 9080
grpc_listen_port: 0
positions:
filename: /var/lib/promtail/positions.yaml # File for tracking log positions
clients:
- url: http://localhost:3100/loki/api/v1/push # URL for sending logs to Loki
scrape_configs:
- job_name: system
static_configs:
- targets:
- localhost
labels:
job: varlogs
__path__: /var/log/*log # Collect all .log files from /var/log
host: YOUR_HOSTNAME # Replace with the actual hostname of your VPS
pipeline_stages:
- docker: {} # Example, if Promtail were in Docker, other parsers could be used here
- match:
selector: '{job="varlogs"}'
stages:
- regex:
expression: '^(?PIMPORTANT: Replace YOUR_HOSTNAME with the actual hostname of your VPS. Also, ensure that the log paths (/var/log/*log, /var/log/nginx/access.log, /var/log/nginx/error.log) match your system.
Save the file. Now, let's create a Systemd service for Promtail.
sudo nano /etc/systemd/system/promtail.service
Insert the following content:
[Unit]
Description=Promtail log collector
After=network.target

[Service]
User=promtail
Group=promtail
Type=simple
ExecStart=/usr/local/bin/promtail -config.file /etc/promtail/config.yaml
Restart=on-failure
RestartSec=5s

[Install]
WantedBy=multi-user.target
Save the file, reload Systemd, and start Promtail:
sudo systemctl daemon-reload
sudo systemctl start promtail
sudo systemctl enable promtail
Check Promtail's status:
sudo systemctl status promtail
It should show active (running).
Nginx Configuration
Nginx will act as a reverse proxy for Loki. First, let's remove the default Nginx configuration:
sudo rm /etc/nginx/sites-enabled/default
Let's create a new configuration file for Loki, for example, /etc/nginx/sites-available/loki.conf.
sudo nano /etc/nginx/sites-available/loki.conf
Insert the following content. Replace your.domain.com with your domain, which will point to your VPS.
server {
    listen 80;
    listen [::]:80;
    server_name your.domain.com; # Replace with your domain

    location / {
        proxy_pass http://localhost:3100; # Proxy requests to Loki
        proxy_set_header Host $host;
        proxy_set_header X-Real-IP $remote_addr;
        proxy_set_header X-Forwarded-For $proxy_add_x_forwarded_for;
        proxy_set_header X-Forwarded-Proto $scheme;
        proxy_read_timeout 300s; # Increase timeout for large requests
    }
}
Save the file. Now, activate this configuration by creating a symbolic link:
sudo ln -s /etc/nginx/sites-available/loki.conf /etc/nginx/sites-enabled/
Check the Nginx configuration for errors and restart it:
sudo nginx -t
sudo systemctl restart nginx
If there are no errors, Nginx should restart successfully.
Setting up HTTPS with Certbot
For secure access to Loki via Nginx, we will use Certbot to obtain a TLS certificate from Let's Encrypt.
sudo certbot --nginx -d your.domain.com
Certbot will guide you through the process. You will need to enter an email address for notifications and agree to the terms of service. It will automatically detect your Nginx server block for your.domain.com and modify it, adding HTTPS settings and HTTP to HTTPS redirection.
After successful Certbot setup, your /etc/nginx/sites-available/loki.conf file will look approximately like this (Certbot will add its directives):
server {
    listen 80;
    listen [::]:80;
    server_name your.domain.com;

    # Certbot will add HTTPS redirection here
    return 301 https://$host$request_uri;
}

server {
    listen 443 ssl http2;
    listen [::]:443 ssl http2;
    server_name your.domain.com;

    ssl_certificate /etc/letsencrypt/live/your.domain.com/fullchain.pem; # Path to certificate
    ssl_certificate_key /etc/letsencrypt/live/your.domain.com/privkey.pem; # Path to private key
    include /etc/letsencrypt/options-ssl-nginx.conf;
    ssl_dhparam /etc/letsencrypt/ssl-dhparams.pem;

    location / {
        proxy_pass http://localhost:3100;
        proxy_set_header Host $host;
        proxy_set_header X-Real-IP $remote_addr;
        proxy_set_header X-Forwarded-For $proxy_add_x_forwarded_for;
        proxy_set_header X-Forwarded-Proto $scheme;
        proxy_read_timeout 300s;
    }
}
Certbot will also configure automatic certificate renewal. You can check this:
sudo systemctl status certbot.timer
sudo certbot renew --dry-run
Verifying Functionality
Let's ensure that all components are working correctly.
- Loki Check:
curl -v http://localhost:3100/readyIt should return a
200 OKstatus and the messageLoki is ready. - Promtail Check:
sudo journalctl -u promtail.service -fYou will see Promtail logs. Ensure there are no errors when sending logs to Loki.
- Nginx and HTTPS Check:
Open
https://your.domain.comin your browser. You should see the Loki interface. If you see a404or502 Bad Gatewayerror, check Nginx logs (/var/log/nginx/error.log) and Loki logs. - Loki Log Check:
From the command line, you can make a request to Loki via
curlto ensure that logs are being received:curl -G "https://your.domain.com/loki/api/v1/query_range" --data-urlencode 'query={job="varlogs"}' | jq .You should see a JSON response with your logs. If
jqis not installed, install it:sudo apt install jq -y.For more convenient log viewing, you can connect Loki to Grafana. Install Grafana on a separate server or as a Docker container and add Loki as a data source. Then you can use the LogQL query language in Grafana Explore.
Backups and Maintenance
Backup and regular maintenance are critically important for any system, especially for a logging system where data loss can be catastrophic.
What to Back Up
For Loki, the main data to back up is:
- Configuration Files:
/etc/loki/config.yaml,/etc/promtail/config.yaml, Nginx configuration/etc/nginx/sites-available/loki.conf, and Let's Encrypt certificates/etc/letsencrypt/. - Loki Data: Directories specified in
storage_config(/var/lib/loki/chunks,/var/lib/loki/boltdb-shipper-active,/var/lib/loki/boltdb-shipper-cache). This data contains the logs themselves and their indexes. - Promtail Positions: The file
/var/lib/promtail/positions.yaml. It tracks how far Promtail has read each log file. If lost, Promtail may start reading logs from the beginning after recovery, leading to duplication.
Simple Auto-Backup Script
We will create a simple script that will archive key files and directories. For storing backups, it is recommended to use external storage, not the same VPS.
sudo nano /usr/local/bin/backup_loki.sh
Paste the following content. Replace /path/to/your/backup/destination with the actual path to your backup directory (e.g., a mounted S3 bucket or NFS resource).
#!/bin/bash

# Directory for temporary backups
BACKUP_DIR="/tmp/loki_backup_$(date +%Y%m%d%H%M%S)"
mkdir -p "$BACKUP_DIR"

# Directory for storing final archives
FINAL_BACKUP_DESTINATION="/path/to/your/backup/destination" # REPLACE THIS PATH
mkdir -p "$FINAL_BACKUP_DESTINATION"

# Files and directories for backup
CONFIG_FILES="/etc/loki/config.yaml /etc/promtail/config.yaml /etc/nginx/sites-available/loki.conf"
LETSENCRYPT_DIR="/etc/letsencrypt"
LOKI_DATA_DIR="/var/lib/loki"
PROMTAIL_POSITIONS="/var/lib/promtail/positions.yaml"

# Copy configuration files and certificates
cp -r $CONFIG_FILES "$BACKUP_DIR/"
cp -r $LETSENCRYPT_DIR "$BACKUP_DIR/"
cp $PROMTAIL_POSITIONS "$BACKUP_DIR/"

# Stop Loki and Promtail for consistent data backup
# IN PRODUCTION, consider more complex methods for hot backup or replication
sudo systemctl stop loki
sudo systemctl stop promtail

# Copy Loki data (this can take a long time for large volumes)
# Use rsync for incremental copying
sudo rsync -az "$LOKI_DATA_DIR" "$BACKUP_DIR/"

# Start Loki and Promtail back up
sudo systemctl start loki
sudo systemctl start promtail

# Create archive
ARCHIVE_NAME="loki_backup_$(date +%Y%m%d%H%M%S).tar.gz"
tar -czf "$FINAL_BACKUP_DESTINATION/$ARCHIVE_NAME" -C "$BACKUP_DIR" .

# Delete temporary files
rm -rf "$BACKUP_DIR"

# Clean up old backups (e.g., keep for 7 days)
find "$FINAL_BACKUP_DESTINATION" -name "loki_backup_*.tar.gz" -type f -mtime +7 -delete

echo "Loki backup completed: $FINAL_BACKUP_DESTINATION/$ARCHIVE_NAME"
Make the script executable:
sudo chmod +x /usr/local/bin/backup_loki.sh
Where to Store Backups
Never store backups on the same server as the original data. If the server fails, you will lose both your data and your backups.
- External S3-compatible object storage: The most common and reliable option. Use services like AWS S3, DigitalOcean Spaces, Backblaze B2, or MinIO (for self-hosted). Utilities like
s3cmdorrclonecan be used for uploading. - Separate VPS/Dedicated server: Allocate a separate server specifically for storing backups. You can use
rsyncover SSH to copy archives. - NFS storage: If you have centralized network storage.
For integration with S3-like storage, you can install s3cmd or rclone and add an upload command to your backup script.
# Example of adding to backup_loki.sh script for S3 (after tar.gz creation)
# sudo apt install rclone -y
# rclone config # Configure rclone for your S3 provider
# rclone copy "$FINAL_BACKUP_DESTINATION/$ARCHIVE_NAME" "your_s3_remote:your-bucket-name/loki-backups/"
Automating Backups with Cron
Add the script to Cron's schedule for daily execution:
sudo crontab -e
Add the following line to execute the script daily at 03:00 AM:
0 3 * * * /usr/local/bin/backup_loki.sh >> /var/log/loki_backup.log 2>&1
Updates: Rolling vs. Maintenance Window
- Rolling updates (for a cluster): If Loki is deployed in a cluster (which we did not do in this tutorial, as it's a VPS), you can update nodes one by one to maintain system availability.
- Maintenance window (for a single VPS): For a single VPS, as in our case, Loki and Promtail updates will require a short "maintenance window" during which services will be stopped.
- Stop Promtail and Loki.
- Download new binary files.
- Replace old binaries with new ones.
- Start Loki, then Promtail.
- Check logs and functionality.
It is recommended to perform updates during off-peak hours and always have a fresh backup.
Troubleshooting + FAQ
This section collects common problems and questions that may arise during the deployment and operation of Grafana Loki.
Loki or Promtail does not start, or is inactive. What to do?
If the Loki or Promtail service does not start or its status failed, the first thing to check is the Systemd logs. Use the commands:
sudo systemctl status loki.service
sudo journalctl -u loki.service -f
Similarly for Promtail: sudo systemctl status promtail.service and sudo journalctl -u promtail.service -f. Logs often contain information about configuration errors, file access issues, or occupied ports. Make sure that the config.yaml configuration files are syntactically correct (use an online YAML validator) and that the loki/promtail user has read permissions for configuration files and write permissions for data directories.
I don't see logs in Loki UI (via Grafana or curl).
If logs are not being received, check the following:
- Promtail Status: Make sure Promtail is running and operating without errors (
sudo systemctl status promtail). - Promtail Logs: Check Promtail logs (
sudo journalctl -u promtail.service -f) for errors when sending logs to Loki. Common errors:connection refused(Loki is not available),400 Bad Request(problem with log format or labels). - Promtail Configuration: Make sure that the Loki
url(http://localhost:3100/loki/api/v1/push) is correctly specified in/etc/promtail/config.yamland that the paths to log files (__path__) are correct and readable by thepromtailuser. - Loki Status: Make sure Loki is running and accessible on port 3100.
- Firewall: Check that port 3100 is open if Loki and Promtail are on different servers or Promtail is trying to connect to Loki via a public IP.
Nginx returns a 502 Bad Gateway or 404 Not Found error.
A 502 Bad Gateway error usually means that Nginx cannot connect to the backend (in this case, Loki). Check:
- Loki Status: Make sure Loki is running and listening on
localhost:3100. - Nginx Logs: Check
/var/log/nginx/error.log. It will precisely indicate the cause of the error, for example,connection refused. - Nginx Configuration: Check the file
/etc/nginx/sites-available/loki.conf. Make sure thatproxy_pass http://localhost:3100;is correctly specified.
A 404 Not Found error may indicate an incorrect location / configuration in Nginx or that Loki does not have such a path.
What is the minimum VPS configuration suitable for Grafana Loki?
For small projects, such as a personal blog, a small SaaS application, or several microservices generating up to 100 GB of logs per month, a VPS with 2 CPU cores, 4 GB RAM, and 100-200 GB NVMe SSD will be minimally suitable. Disk speed is more critical here than raw capacity, as Loki actively works with the disk. Ensure that the chosen tariff plan offers a sufficiently fast SSD for efficient operation with indexes and log chunks.
What to choose — VPS or dedicated for this task?
The choice between a VPS and a dedicated server depends on the scale of your task. For most individual developers, small teams, and projects with log volumes up to 1-2 TB per month, a VPS will be the optimal choice in terms of cost and ease of management. Loki is designed to be lightweight, making it ideal for a VPS. A dedicated server becomes necessary when maximum performance, guaranteed resources without overselling, very large log volumes (terabytes per day), or specific hardware requirements (e.g., RAID arrays for disks, high-performance network cards) are needed. If you are just starting, always choose a VPS, and then scale up to a dedicated server if a real need arises.
How to ensure Loki's security?
In this tutorial, we disabled authentication (auth_enabled: false) for simplicity, but this is unacceptable for production. It is recommended:
- Basic Auth via Nginx: Nginx can provide basic HTTP authentication before proxying requests to Loki.
- OIDC/OAuth2: If you use Grafana, it supports integration with OIDC/OAuth2, which allows for centralized authentication.
- TLS/HTTPS: Ensure that all traffic to Loki goes over HTTPS (which we configured with Nginx and Certbot).
- Firewall: Restrict access to Loki ports only for necessary IP addresses.
- Principle of least privilege: Loki and Promtail run under separate system users with limited rights.
How to connect Grafana to Loki?
After deploying Loki, you can easily connect it to Grafana. To do this:
- Install Grafana (if you haven't already).
- In Grafana, go to
Configuration -> Data Sources. - Click
Add data sourceand selectLoki. - In the
URLfield, specify the address of your Loki server, for example,https://your.domain.com. - If you are using authentication (e.g., Basic Auth via Nginx), provide the corresponding credentials.
- Click
Save & Test.
After this, you will be able to use Loki as a data source in Grafana Explore to query logs using LogQL and create dashboards.
Conclusion and Next Steps
Congratulations! You have successfully deployed and configured a powerful and cost-effective centralized logging system on your VPS using Grafana Loki, Promtail, and Nginx. Now you have full control over your logs, the ability to quickly search and analyze events, which significantly simplifies debugging and monitoring of your applications and server.
Next steps for developing your system:
- Grafana Integration: Connect your Loki server to an existing or new Grafana installation. This will allow you to leverage Grafana's powerful visualization capabilities, create dashboards, alerts, and perform deeper log analysis using the LogQL query language.
- Loki Monitoring: Set up monitoring for Loki itself using Prometheus and Grafana. Loki provides metrics in Prometheus format, which can be collected and visualized to track its performance and status.
- Scaling and High Availability: If your log volume significantly increases, consider scaling Loki by adding additional instances, using object storage (S3-compatible) instead of a filesystem for log chunks, and distributed storage for indexes (e.g., Consul or Etcd).
- Expanding Log Collection: Configure Promtail to collect logs from all your applications, including Docker containers (if you use them), as well as from other servers, if you have any.